The Stat-Sig Trap in a Hypothesis Testing Interview
The experiment looks like a win. Treatment activated 12,215 users out of 47,900. Control activated 11,568 out of 48,200. The design team is excited about 18% faster onboarding. The PM wants a recommendation by end of day. Most candidates will run a proportion test, see a p-value below 0.05, and say launch.
That is the trap. The rubric for this 30-minute mid-level Data Analyst interview awards 60 of its 100 points across two dimensions (Interviewer Objectives Alignment and Level-Specific Expectations) specifically for what you do beyond the obvious answer: noticing the retention dip in the treatment arm, questioning the completers-only framing of the design team's 18% figure, handling post-hoc segmentation correctly, and landing a recommendation that holds up in a cross-functional product review. You can get the statistics right and still score below 50.
Key Findings
- The rubric is 100 points across 4 dimensions: Interviewer Objectives Alignment (30 pts), Level-Specific Expectations (30 pts), Technical Proficiency (20 pts), and Communication and Problem Solving (20 pts).
- The interview runs 30 minutes in 3 phases: problem framing (0-7 min), test selection and interpretation (7-19 min), and assumptions and recommendation (19-30 min).
- Phase 2 and Phase 3 each carry 5 checklist items, tied for the largest per-phase load; Phase 2 specifically covers confidence interval and practical significance interpretation.
- The experiment involves roughly 96,100 users with an observed activation lift of approximately 1.5 percentage points and a slight day-7 retention dip in the treatment arm.
- At least 4 embedded traps appear in the scenario: a self-selected completers subset, cross-device measurement risk, post-hoc segmentation across 3 dimensions, and a guardrail metric moving against the treatment.
- Mid-level expectations include independently raising clarifying questions about randomization quality and launch criteria without waiting to be prompted.
- The 3 follow-ups on assumptions, practical significance, and segmentation account for the bulk of Phase 2 and Phase 3 scoring.
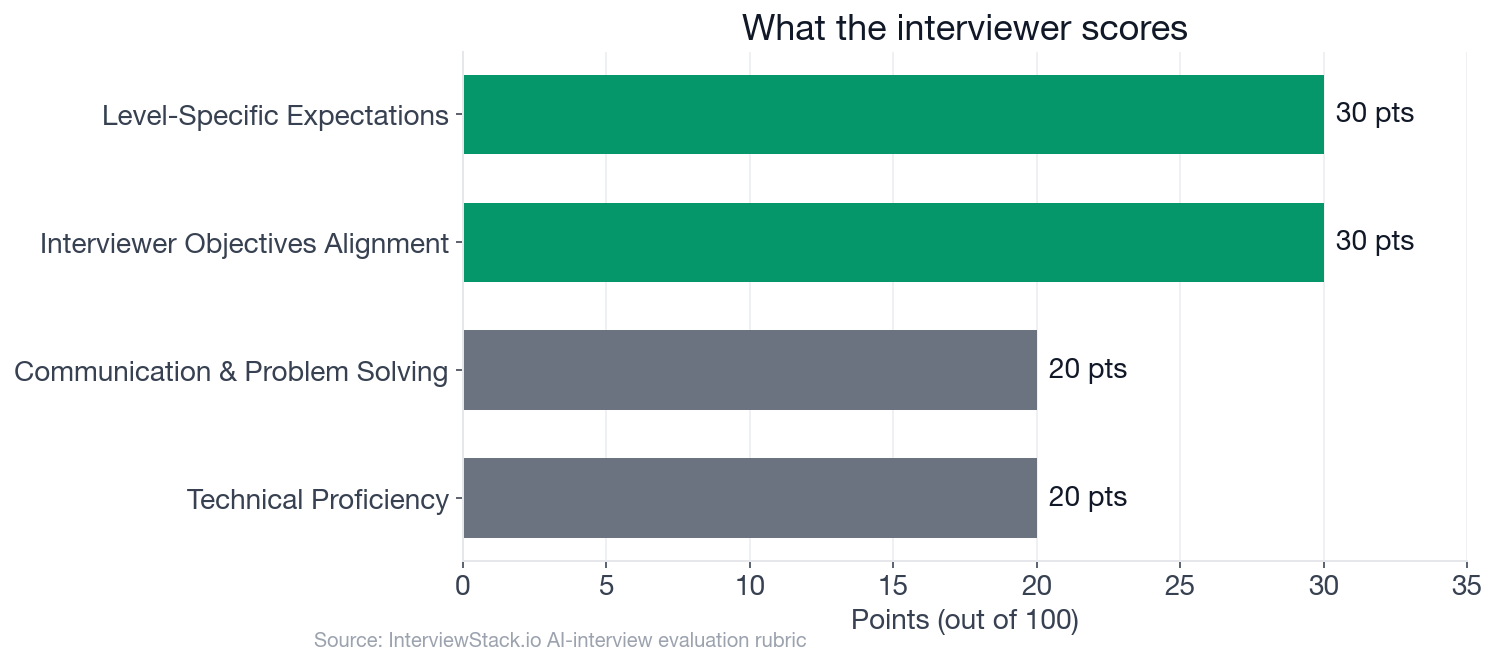 The four rubric dimensions by point weight. Interviewer Objectives and Level-Specific Expectations together account for 60 of the 100 available points.
The Question
The interview question
You are supporting a consumer product team at a large tech company. The team ran a 14-day randomized experiment on a new onboarding flow intended to improve activation for newly registered users.
The primary metric is 7-day activation rate, defined as whether a new user completes all required setup steps within 7 days of signup.
Experiment: New User Onboarding Redesign Population: newly registered users in US and Canada Randomization unit: user_id Duration: 14 daysControl: users = 48,200 activated_within_7d = 11,568 day_7_retained = 8,194
Treatment: users = 47,900 activated_within_7d = 12,215 day_7_retained = 8,010
Additional context:
- The PM wants a launch recommendation by end of day.
- The design team is excited: treatment reduced median time-to-complete onboarding by 18% among users who finished onboarding.
- About 6% of users signed up on one device and completed onboarding on another device.
- The team also looked at activation by country, platform, and acquisition channel after the initial topline readout.
How would you evaluate this experiment and decide what recommendation to give the product team?
The interviewer is probing whether you can frame a product-facing inference problem from ambiguous business context, connect statistical decisions to real analyst realities like guardrail metrics and segmentation risk, and deliver a recommendation that a cross-functional product team can act on under a tight deadline.
What a Data Analyst Hypothesis Testing Interview Actually Tests
The four turns below cover the highest-signal follow-ups from this scenario: test selection, practical significance, assumptions, and post-hoc segmentation. These are where points most commonly move.
Turn 1: Hypotheses and Test Selection
Interviewer: "What null and alternative hypotheses would you define for the primary metric, and what statistical test would you use here?"
Turn 2: p-Value vs Practical Significance
Interviewer: "How would you interpret the treatment effect if the p-value were below 0.05 but the absolute lift were very small?"
Turn 3: Assumptions and the Retention Red Flag
Interviewer: "What assumptions are you relying on in this analysis, and which of them worry you most given the context above?"
Turn 4: Post-Hoc Segmentation
Interviewer: "The team sliced results by country, platform, and acquisition channel after seeing the topline results. How would you handle those findings?"
Reading About Mistakes Is Not the Same as Avoiding Them Live
You just watched Marcus lose points on problems he would have recognized in a study guide. The gap is not knowledge of hypothesis testing. It is performance under time pressure, with an unscripted follow-up, a PM pushing back on the retention concern, and 30 seconds of silence while you work out whether the cross-device issue actually threatens the randomization in this specific experiment.
That gap closes with reps, not reading. The AI mock interview for Data Analyst: Hypothesis Testing and Inference runs this exact scenario type, tracks you against the live Blueprint in real time, and gives you turn-by-turn coaching notes on which checklist items you hit. You can be in the seat in under a minute.
For focused question-level drilling before the mock, the Hypothesis Testing and Inference question bank covers every level from basic framing questions to the harder follow-ups on power, guardrail conflicts, and sequential testing. And if you want to see how frequently these skills appear in live job postings, browse current Data Analyst openings on the InterviewStack.io job board.
The Complete Blueprint: What a Strong Candidate Hits
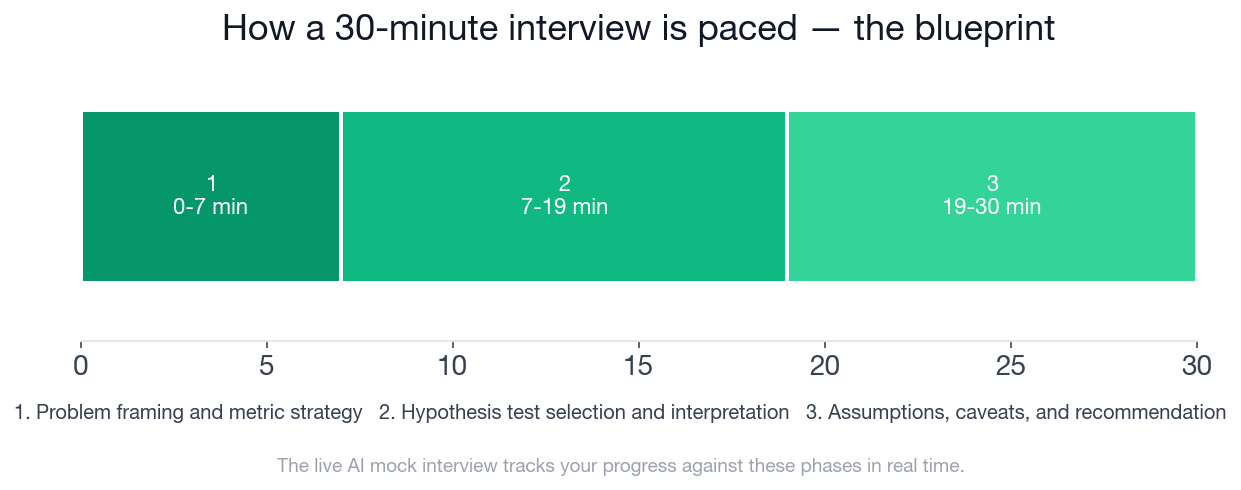 The three phases of a strong 30-minute hypothesis testing interview, with the expected time window and key objectives for each phase.
This is exactly what the AI mock interview tracks you against in real time, phase by phase:
- ✓States that 7-day activation is the primary metric to anchor the decision
- ✓Notes that day-7 retention is an important guardrail or secondary outcome
- ✓Recognizes that faster completion among completers is not itself sufficient for launch
- ✓Asks at least one relevant clarifying question about randomization quality, metric definitions, or launch criteria
- ✓Defines a null hypothesis of no difference in activation rate between control and treatment and an appropriate alternative
- ✓Chooses a two-sample test for proportions or equivalent interval-based comparison for the primary metric
- ✓Calculates or approximates the observed lift directionally and discusses absolute versus relative impact
- ✓Uses confidence intervals or p-value interpretation correctly without overstating certainty
- ✓Mentions practical significance and not just whether a threshold like 0.05 is crossed
- ✓Identifies at least two realistic threats such as cross-device measurement gaps, post-hoc slicing, or potential retention tradeoff
- ✓Explains why post-readout segmentation raises multiple comparison concerns and that such cuts are exploratory unless pre-registered or corrected
- ✓Discusses whether randomization by user_id is appropriate and where independence or attribution could still break
- ✓Gives a concrete recommendation tied to evidence, such as launch, do not launch, or run a follow-up with explicit rationale
- ✓Suggests a sensible next step if evidence is mixed, such as validating instrumentation, extending duration, or designing a confirmatory follow-up test
FAQ
Q. What is tested in a data analyst hypothesis testing interview?
Interviewers test your ability to frame a business experiment as a statistical problem, select the right test for the outcome type, interpret p-values and confidence intervals correctly without overstating certainty, identify assumptions and real-world threats to validity, and deliver a clear recommendation that a non-technical product team can act on.
Q. What statistical test should a data analyst use for a binary A/B test outcome?
For a binary outcome like activation rate, the standard approach is a two-sample test for proportions (a two-proportion z-test) or an equivalent confidence interval comparison. The test compares the proportion of users who activated in control versus treatment. A t-test is acceptable for large samples but the proportion test is the more precise choice for binary outcomes.
Q. What is the most common mistake in a data analyst hypothesis testing interview?
The most common mistake is treating a p-value below 0.05 as sufficient justification to launch. Interviewers expect you to reason about practical significance, secondary metric guardrails, and the real-world assumptions the test relies on. Stopping at p below 0.05 loses points on the Level-Specific Expectations dimension, which accounts for 30 of the 100 rubric points.
Q. How does post-hoc segmentation affect a launch recommendation?
Post-hoc segmentation (slicing results by country, platform, or channel after seeing the topline readout) raises multiple comparison concerns because those cuts were not pre-registered. Each additional comparison increases the probability of a false positive. In an interview, the correct frame is that these subgroup findings are hypothesis-generating and exploratory, not confirmatory evidence for the current launch decision.
Q. What is practical significance and why does it matter in an experiment interview?
Practical significance asks whether the measured effect is large enough to matter for the business, even if it is statistically significant. With roughly 96,100 users in an experiment, effects as small as around 0.55 percentage points can cross the statistical significance threshold, meaning technically real differences may still be too small to justify launch costs. Practical significance pushes you to ask whether the activation lift justifies the engineering and rollout costs and whether the user experience gain is durable.
Q. How is a data analyst hypothesis testing interview scored?
The rubric has four dimensions worth 100 points total: Interviewer Objectives Alignment (30 points), Level-Specific Expectations (30 points), Technical Proficiency (20 points), and Communication and Problem Solving (20 points). For mid-level analysts, Interviewer Objectives and Level-Specific together account for 60 points and reward structured framing, independent clarifying questions, and decision-quality recommendations.
Q. How long is a data analyst hypothesis testing interview?
A standard format runs 30 minutes across three phases: problem framing and metric strategy (minutes 0-7), hypothesis test selection and interpretation (minutes 7-19), and assumptions, caveats, and recommendation (minutes 19-30). The longest phase is the middle one, but interviewers often weight the final phase heavily because it reveals how a candidate handles imperfect evidence.
What Separates Knowing From Performing
The blueprint above is not hidden information. You can study the 14 checklist items, memorize the correct test for a binary outcome, and know that post-hoc segmentation inflates false positive rates. What you cannot shortcut is the moment when you are 20 minutes into a live interview and the PM's retention objection catches you mid-sentence. The preparation gap for Data Analyst roles is almost always there, not in the theory.
Topics
Ready to practice?
Put what you've learned into practice with AI mock interviews and structured preparation guides.