When the Math Is Right and the Interview Isn't
A million-user randomized experiment with a clean 50/50 split and a binary primary metric. This setup looks like a gift: the analysis almost writes itself. That's exactly why it catches mid-level Data Scientist candidates off guard. The interviewer isn't testing whether you can run a proportion test. They're testing whether you frame the decision correctly before running anything, whether you catch the unit-of-analysis trap when the PM pivots, and whether you can separate "statistically real" from "worth launching." Those skills live in the 60 points tied to Interviewer Objectives Alignment and Level-Specific Expectations, and they're where most candidates quietly lose the interview.
Key Findings
- The rubric allocates 30 points each to Interviewer Objectives Alignment and Level-Specific Expectations, totaling 60 of 100 points on structured framing and depth of reasoning.
- Technical Proficiency and Communication each carry 20 points, meaning raw calculation accuracy is the smaller half of the score.
- Phase 1 (0-7 minutes) has 4 checklist items that must be hit before any calculation: anchoring on the randomized unit, formulating hypotheses, and asking at least one clarifying question about thresholds or test direction.
- Phase 2 (7-20 minutes) spans 13 minutes and includes 6 checklist items covering test selection, confidence intervals, p-value interpretation, power, and assumption checks.
- Phase 3 (20-30 minutes) covers 5 edge cases: unit mismatch, multiple comparisons, practical versus statistical significance, guardrail conflicts, and a structured recommendation.
- Mid-level candidates are expected to propose a complete end-to-end testing approach independently, without prompts or major hints.
- Post-hoc slicing across 3 or more dimensions without acknowledging multiple comparisons is a named Phase 3 pitfall mapped directly to the Interviewer Objectives Alignment dimension.
Here is how the question arrives:
The interview question
A product team at a large consumer tech company ran a 2-week randomized experiment on the search results page. The treatment adds a new module intended to improve engagement by showing personalized follow-up queries. The team's primary question is whether the feature should launch broadly. You are given this experiment summary:
Experiment unit: user Randomization: 50/50 at user level Population: signed-in users on mobile app Duration: 14 daysGroup summary:
- Control: 498,200 users, 1,941,600 search sessions, 611,400 users with at least one search click
- Treatment: 501,800 users, 1,997,900 search sessions, 624,100 users with at least one search click
Primary metric proposed by PM:
- clickthrough_user_rate = % of users who had at least one search result click during the experiment
Secondary metrics the team cares about:
- searches_per_user
- downstream_conversion_rate
- app_latency_p95
How would you determine whether this experiment provides enough evidence to recommend launching the feature?
The interviewer's objectives run deeper than test selection. They want to see you translate the business question into a testable framework, anchor on the randomized unit, ask about decision thresholds before calculating, and deliver a recommendation that weighs statistical evidence against product reality. The scenario is designed to surface whether you do all four or only the part visible from the data.
How Does a Data Scientist Hypothesis Testing Interview Actually Run?
The 30-minute session moves through three phases. These four turns are where mid-level candidates most often leave points behind.
Turn 1: Hypotheses and test selection
Interviewer: "What null and alternative hypotheses would you write for the primary metric, and what test would you use here?"
Turn 2: Unit-of-analysis mismatch
Interviewer: "If the PM instead wanted to analyze clicks at the search-session level, what concerns would you raise about independence or unit-of-analysis mismatch?"
Turn 3: Statistical vs practical significance
Interviewer: "How would you think about statistical significance versus practical significance for this launch decision?"
Turn 4: Post-hoc slicing and multiple comparisons
Interviewer: "If several slices were checked after the fact, such as country, device model, and new versus returning users, how would that change your interpretation?"
Why Reading This Once Is Not Enough
You just watched four mistakes from a safe distance, with the rubric in front of you and time to think. In the actual 30-minute interview, these turns arrive without labels. The phases blend together. The interviewer's pivots can pull you off your framing mid-answer. The gap between recognizing a mistake on a page and not making it live, under unscripted follow-ups, is the gap that only repetition closes. Reading a walkthrough once adds vocabulary. Performing the reasoning under time pressure and ambiguity is the actual skill the interview is testing.
The Complete Blueprint
This is the blueprint a strong candidate hits across the 30 minutes, and exactly what the AI mock interview tracks you against in real time.
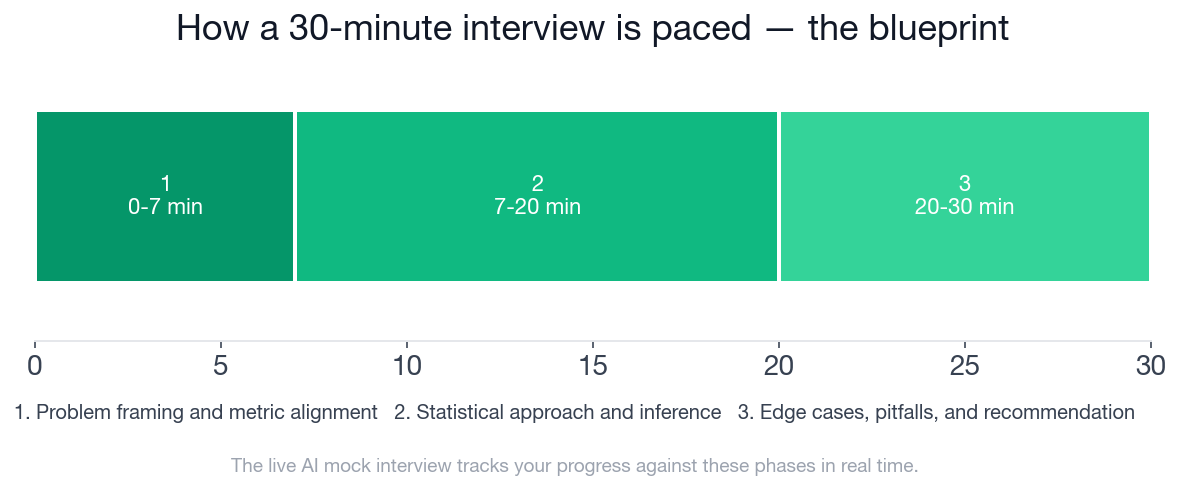
The chart shows how the 30 minutes distribute across problem framing, statistical approach, and edge cases. Here is the full per-phase checklist:
- ✓States that the launch decision should be based on the pre-defined primary metric plus guardrails, not only on any metric that moved
- ✓Identifies user-level randomization and notes the primary metric is a user-level binary outcome
- ✓Formulates null and alternative hypotheses in words or notation
- ✓Asks at least one clarifying question about decision thresholds, minimum meaningful lift, or whether the test is one-sided versus two-sided
- ✓Chooses an appropriate test for the primary metric, such as a two-sample test for proportions, chi-square test on user-level outcomes, or equivalent modeling approach
- ✓Describes how to estimate treatment effect as an absolute or relative lift and pair it with a confidence interval
- ✓Explains what the p-value does and does not mean, avoiding statements like 'probability the null is true'
- ✓Discusses significance level and Type I/Type II errors in the context of a launch recommendation
- ✓Mentions power or minimum detectable effect when discussing whether evidence is sufficient
- ✓Notes key assumptions or validity checks such as proper randomization, independence at the user level, stable metric definitions, and sample ratio sanity check
- ✓Raises concern if analysis is shifted from user-level randomization to session-level inference without adjustment
- ✓Mentions how to handle multiple comparisons or post-hoc slicing qualitatively, such as treating them as exploratory or adjusting for multiplicity
- ✓Explains how a statistically significant but tiny effect may not justify launch, especially if latency or conversion worsens
- ✓Provides a concrete recommendation structure: launch, do not launch, or run longer / rerun, with rationale tied to evidence and guardrails
- ✓Communicates uncertainty and caveats clearly rather than presenting a binary answer without conditions
Ready to Take This Live?
The blueprint above is also the live scoring card the AI mock interview runs against your answers in real time. You get unscripted follow-up questions, a phase-by-phase breakdown of where you lost points, and specific coaching on each rubric dimension after the session.
Start the AI mock interview: Data Scientist, Hypothesis Testing and Inference. You can go from this page to a live 30-minute session in under a minute.
If you want to drill specific concepts first, the Hypothesis Testing and Inference question bank has targeted questions on p-value interpretation, power analysis, and experiment validity. You can also browse open Data Scientist roles to see which companies are actively hiring and which topics their postings emphasize, or explore the Data Scientist preparation guide for a broader picture of how these interviews are structured across companies.
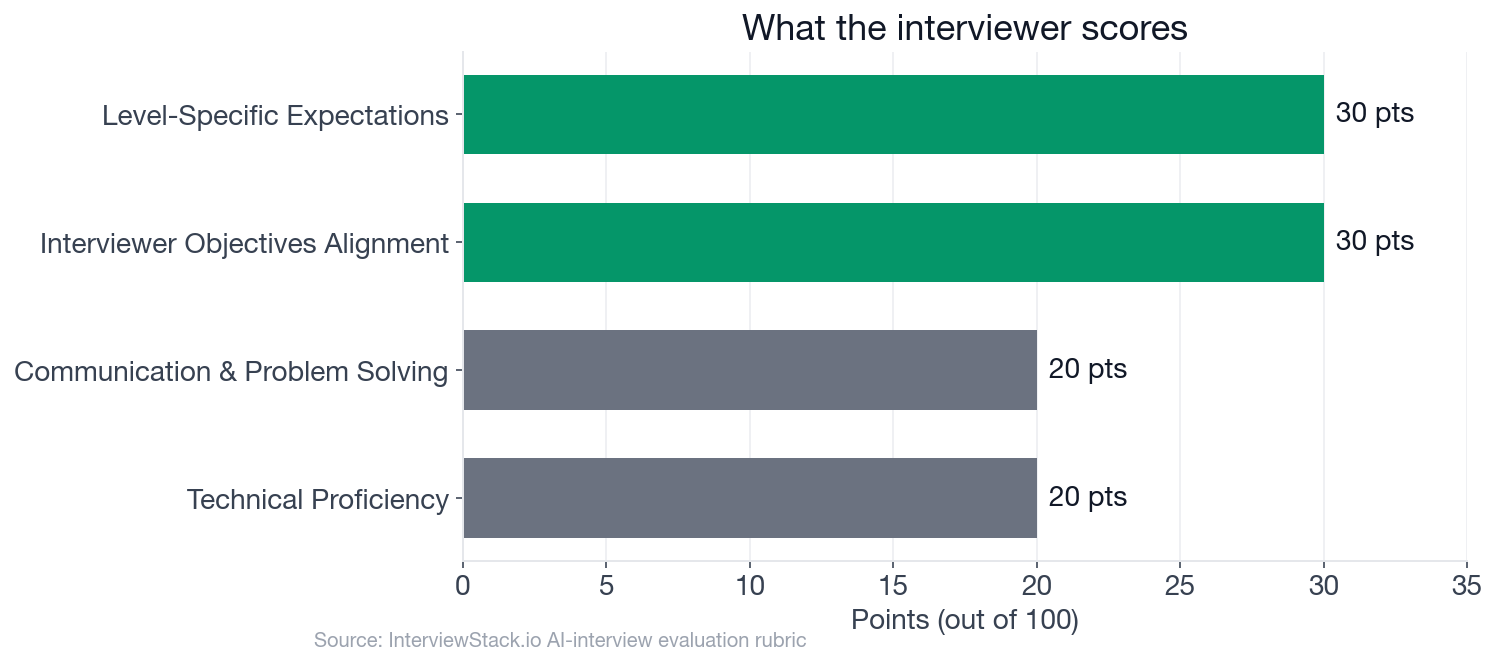
The chart above shows how 100 rubric points distribute across the four dimensions. Objectives Alignment and Level-Specific Expectations together account for 60 points, which is why framing the problem correctly before touching the math is the highest-leverage move in this interview.
FAQ
Q. What test should a mid-level Data Scientist use for a binary user-level metric in an A/B experiment?
A two-sample test for proportions (or equivalently a chi-square test on the 2x2 contingency table) is appropriate when the randomization unit is the user and the metric is a binary user-level outcome. The key constraint is that the analysis unit must match the randomization unit. At the mid level, selecting this independently is a required checklist item in Phase 2 (7-20 minutes) and factors into the Interviewer Objectives Alignment dimension, which carries 30 of 100 rubric points.
Q. What does a p-value mean in the context of a product launch decision?
A p-value is the probability of observing a test statistic as extreme as the one measured, or more extreme, assuming the null hypothesis is true. It is not the probability that the null hypothesis is true. In a launch context, a p-value below the significance threshold means the observed difference is unlikely due to chance, but it says nothing about whether the effect is large enough to justify launching. That judgment requires pairing the p-value with a confidence interval and comparing the lift to a pre-specified minimum meaningful threshold.
Q. Why does unit-of-analysis matter when a PM asks for session-level analysis in an A/B experiment?
When an experiment randomizes at the user level, sessions from the same user are correlated. Switching to session-level analysis without accounting for that correlation inflates the effective sample size, understates standard errors, and produces confidence intervals that are too narrow. A non-significant effect can appear statistically significant. The valid options are to keep the analysis at the user level, or to use a clustered variance estimator such as the delta method or a user-level bootstrap that respects the randomization structure.
Q. How should a Data Scientist weigh statistical significance against practical significance in a launch recommendation?
Statistical significance confirms the observed difference is unlikely due to chance. Practical significance asks whether the effect is large enough to matter given business context. A mid-level Data Scientist is expected to report both the absolute lift with a confidence interval and compare it to the team's pre-specified minimum detectable effect or launch threshold. Guardrail metrics such as latency and downstream conversion also factor in: a significant primary metric improvement does not justify launch if a guardrail has meaningfully degraded.
Q. How should post-hoc slices be interpreted in an A/B experiment?
Post-hoc slices checked after the fact are exploratory, not confirmatory. Running 10 exploratory slices at a 5% significance level produces roughly a 40% probability of at least one false positive by chance alone. The correct framing is to treat these findings as hypotheses to validate in a future pre-registered experiment rather than additional evidence for the current launch decision. If formal adjustment is needed, Bonferroni correction can control the family-wise error rate (the probability of any false positive), and Benjamini-Hochberg can control the false discovery rate (the proportion of false positives among significant findings); but honest communication about the exploratory nature is the core skill.
Q. What are the three phases in a Data Scientist hypothesis testing interview and how long does each last?
Phase 1 (0-7 minutes) covers problem framing and metric alignment: translating the business question into a testable hypothesis, anchoring on the randomized unit, and asking at least one clarifying question about decision thresholds or test direction. Phase 2 (7-20 minutes) covers statistical approach and inference: test selection, confidence intervals, p-value interpretation, power, and assumption checks. Phase 3 (20-30 minutes) covers edge cases, pitfalls, and recommendation: unit mismatch, multiple comparisons, guardrail conflicts, and a structured launch recommendation.
Q. What is the biggest scoring risk in a mid-level Data Scientist hypothesis testing interview?
The two largest rubric dimensions are Interviewer Objectives Alignment and Level-Specific Expectations, each worth 30 of 100 points. Both reward structured problem framing over calculation accuracy. Candidates who jump directly to test selection without formulating hypotheses, anchoring on the randomization unit, or asking about the minimum detectable effect lose points in both dimensions simultaneously. At the mid level, proposing a sound end-to-end approach independently, without prompting, is the baseline expectation.
The Reps Make the Difference
Knowing the four traps in this walkthrough is useful. Knowing which one you will actually trip over in a live 30-minute session, with an unscripted interviewer and no rubric in sight, is what practice reveals. The blueprint is the map. The live session is where you find out how well you actually know the territory.
Topics
Ready to practice?
Put what you've learned into practice with AI mock interviews and structured preparation guides.